DATA FLOW DIAGRAM
Data flow diagram also called Data Flow Diagram (DFD). DFD is to describe the system modules in a smaller and less easy for the user to understand to understand the field of computer systems that will be done.
DFD also serves to describe the existing system or the new system will be developed logically without considering the physical environment where the data flows, or where data are stored. DFD is a tool that is used in the system development methodology is structured (structured analysis and design). DFD can describe the flow of data within the system with a structured and clear.
CONTEXT DIAGRAM
Context diagram of a process and describe the scope of a system and is the highest level of the DFD that describes the entire input to the system and output of the system. System in the context diagram is limited by Boundary (depicted by broken line). In the context diagram can not have storage (storage).
ZERO DIAGRAM
Zero diagram is a diagram describing the process of the DFD. This diagram provides a view of the overall system in which, showing the main function or process that is, the flow of data and external entity. At this level of data storage possible.
For the process that is not explained in the next level then added to the symbol '*' or 'P' at the end of the process. Balance of input and output (balancing) between 0 to diagram context diagram should be maintained.
DETAILED DIAGRAM
Diagram is a detailed diagram of the process of decipher what is in the diagram zero level or above.
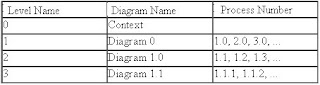
Rules on numbering level DFD:
In one level there should be no more than 7 units and the maximum of 9, when more should be done in the decomposition.
SPECIFICATION PROCESS
Each process in the DFD must have a specification process. At the top level method is used to describe the process you can use with descriptive sentences. At a more detailed level, namely on the bottom (functional primitive) require a more structured specification.
EXTERNAL ENTITY
Specification process will be the guideline for the programmer to make this program (coding). Method used in the specification process: the process of disintegration in the form of a story, decision table, decision tree.
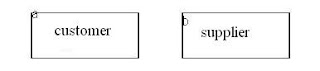
Unit outside is something that is outside the system, but it provides data in the system or to provide data from the system. A symbol of unity in outside the box with the notation. External entity does not include part of the system.
Rules for naming:
1. The name of the noun form.
2. Terminal may not have the same name except the same object (described twice, is intended to more clearly make the diagram). If so, then the terminal should be a forward slash in the top left corner.
3. Name of the flow of data into a process may not be the same as the name of the data flow out of the process.
4. Data flow into or out of the data store does not need to be given a name if:
- Flow data is simple and easily understood.
- Describes the data flow of all data items (one record intact).
5. There can be no flow of data from the terminal to store data or on the contrary, because the terminal is not part of the system. Relationship with the terminal must store data through the process.
External entity symbols:
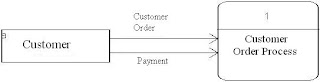
DATA FLOWData flow is place where the information flow. Depicted with the straight line that connects the components of the system. Data flow direction indicated by arrows and the given name on the flow of data flow.
Data flow, flow between processes, data storage and data flow indicates that the form of data input to the system.
Guidelines of the name:
1. Name of the flow of data that consists of some words associated with the flow line speed.
2. No flow data for the same and the name should reflect its contents.
3. The flow of data that consists of several elements can be expressed with the group elements.
4. Avoid using the word 'data' and 'information' to give a name to the flow of data.
5. Wherever possible the complete flow of data is written.
Other provisions:
1. Name of the flow of data into a process may not be the same as the name of the data flow out of the process.
2. Data flow into or out of data storage does not need to be given a name if:
- Flow data is simple and easily understood.
- Describes the data flow of all data items (one record intact).
3. There can be no flow of data from the terminal to the data storage, or vice versa because the terminal is not part of the system, the relationship with the terminal data storage must be through the process.
Data flow symbols:
There are some concepts of data flow that must be considered, namely:
1. The concept of packet data (packet of data).
When two or more data flows from a source to the same destination the same, so should be considered as a single data flow.
2. The concept of data flow spread (diverging data flow).
Shows a number of copies of the same data flow from the same source to a different destination.
3. Gather the data flow concept.
Shows some of the different data flows from different sources join together towards the same goal.
4. The concept of destination and source of flow data.
All data flows must be generated from a process or to a process (can be one or both, that is derived from a process leading to a process is not derived from or is not a process leading to a process or a process come from and go to a process).
PROCESSThe process is also often called bubble is what is done by the system. The process can process the data or incoming data flows into outgoing data flow. Transform the process of working one or more of the input data into one or more of the output data in accordance with the desired specifications. Each process has one or more inputs and produce one or several outputs.
Guidelines of the process:
1. Name of the process consists of a verb and noun, which reflects the function of the process.
2. Do not use the process as part of the name of a bubble.
3. May not have some process that has the same name.
4. The process should be given a number. Order number wherever possible to follow the flow of the process or sequence, but the sequence number does not mean that the absolute is a process in chronological order.
5. Numbering process on the first level (the diagram is zero) is 1.0, 2.0, 3.0, etc.
6. Numbering process on the second level of 1.0 (the details of the process 1.0) is 1.1, 1.2, 1.3, etc.
7. Context diagram (context diagram) does not need to be given a number.
8. The process is the lowest 2.x, not explain again.
Process symbols:
 DATA STORAGE
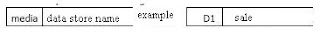
Data storage is a storage place for data that exists in the system. In a symbol with a pair of parallel lines or two lines with one of the side open. The process can retrieve data from or provide data to the database.
Form of data storage are as follows:
• A file or database in the computer system.
• An archive, or manual entry.
• One box of data in a table.
• A table reference manual.
• A book or agenda.
Guidelines of the name:
1. The name should reflect the data storage.
2. When his name more than one word must be marked with the number.
Data storage symbols:
 DFD SYMBOLS
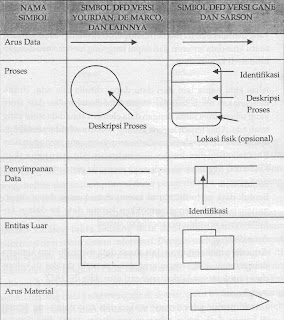
 DATA DICTIONARY
Data dictionary is also called with a system data dictionary is a catalog of facts and data information needs of an information system. Working data dictionary to help the system to interpret the application in detail and organize all elements of the data used in the system precisely so that the system analyst and have a basic understanding of the same input, output, storage and processing.
In the analysis phase, the data dictionary is used as a means of communication between the systems analyst with the user. While in the system design phase, the data dictionary is used to design input, reports and databases.
Flow data on the global DAD, further details can be seen in the data dictionary. Load the data dictionary as follows:
1. Name of data flow: must note that readers who need further explanation about a flow of data can find it easily.
2. Alias: alias or other name of the data can be written if there is.
3. Forms of data: used to segment the data dictionary to use when designing the system.
4. Flow data: indicates from which data flows and where the data.
5. Description: to give an explanation of the meaning of the data flow.
BALANCING IN DFDThere are some balancing between input and output in the DFD, such as:
1. The flow of data into and out of a process must be the same as the flow of data into and out of the details of the process on the level / levels below it.
2. Name of the data flow into and out of the process must match the name of the flow of data into and out of the details of the process.
3. Number and the name of an entity outside the process must be equal to the number of names and entities outside of the details of the process.
4. The issues that must be considered in the DFD which have more than one level:
- There must be a balance between input and output of one level and the next level.
- Balance between level 0 and level 1 at the input / output of stream data to or from the terminal on level 0, while the balance between level 1 and level 2 is seen on the input / output of stream data to / from the process concerned.
- Name of the flow of data, data storage and terminals at each level must be the same if the object is same.
RESTRICTIONS IN DFD
To drawing DFD, there are a few rules or restrictions that must be so in its drawing is not an error occurs, these rules are:
1. Flow data may not be from outside the entity directly to other outside entities without going through a process.
2. Flow data may not be from the savings directly to the data to outside entities without going through a process.
3. Flow data may not be saving the data directly from the savings and other data without going through a process.
4. Flow data from one process directly to the other without going through the process of saving data should or be avoided as much as possible.
DIAGRAM CASH INVESTMENT DATA
There are 2 forms of the DAD:
a. Physical Data Flow Diagram (DADF), more appropriately used to describe the existing system (old system). The emphasis is how the processes of the system is applied (in a way what, where and by whom), including manual processes.
b. Data Flow Diagram Logic (DADL), more appropriately used to describe the system that will be proposed (new system), with no emphasis on how the system implemented, but the emphasis only on the logic of the demand system, that is what the process logic needed by the system.
GUIDELINES TO DRAWING DFD
How to draw the following guidelines for good DAD, DADF or DADL. Example below is for DADL but can also be used for the DADF.
1. Identify the first unit outside of all involved in the system.
For example, sales for the system have involved foreign entity such as customer, credit manager, the warehouse and the delivery.
2. Identification of all input and output involved in union with the outside.
3. First image context diagram (context diagram). DAD is a tool for structured analysis. The structure of this system to try to describe the first time the outline (top level) and split them into the more detailed (lower level) is called overview diagram (level 0). Each overview will be drawn more detailed again called level 1, and each process in level 1 will be drawn back with a detailed level with a 2 and so on until each of these processes can not be drawn again.
4. Chart image tiered process for all that is in the system first. Tiered chart (hierarchy chart) used to prepare DAD drawing to more levels down again. Tiered chart can be drawn using the notation in the DAD.
5. Image to sketch DAD overview diagram (level 0) process based on the tiered chart.
6. DAD-level image to the next level-1 level and beyond.
For example, application DAD sales transactions that must be drawn is a level 1 to process 1, process 2 and process 3.
7. After all drawn level DAD, DAD is drawing to a management reporting drawn separately.
8. After all drawing is wrong, then all this DAD combined in one diagram.
Reference:
- ER Ngurah Agus Sanjaya. Slide Part 4 - DATA FLOW DIAGRAM.
- HM, Jogiyanto. 2007. Analisis & Desain Sistem Informasi. Yogyakarta: ANDI.


.JPG)
.JPG)
.JPG)
.JPG)
.JPG)
.JPG)


